Fleet Inspection Statistics displays the average, maximum, and minimum times it took operators to complete inspections.
The statistics are generated from all inspections currently existing in the account. Inspections are deleted after the account's EVIR retention period. However, inspections which contain unresolved defects remain on the account indefinitely until said defects are resolved.
A benefit of this report is it allows you to track min, max, and average inspection times and defect detection rates.
To access the Fleet Statistics report, click Reports, then Fleet Statistics under EVIR Inspection.
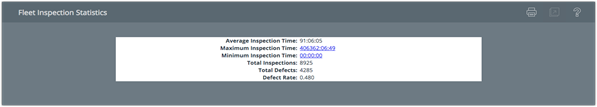
- Average Inspection Time: Displays the average time it took to complete an inspection.
- Minimum Inspection Time: Displays the shortest time it took to complete an inspection. Clicking on the time will display the associated EVIR.
- Maximum Inspection Time: Displays the longest time it took to complete an inspection. Clicking on the time will display the associated EVIR.
- Total Inspections: Displays the total number of inspections performed.
- Total Defections: Displays the total number of defects reported during inspections.
- Defect Rate: Displays the average number of reported defects per inspection.