This report will display when plows or sanders are currently active, and when they are currently active at the same time.
To access the SDOT Plow/Sweep Report, from the main menu click Reports, then go to Custom Reports and click SDOT Plow Sweep.
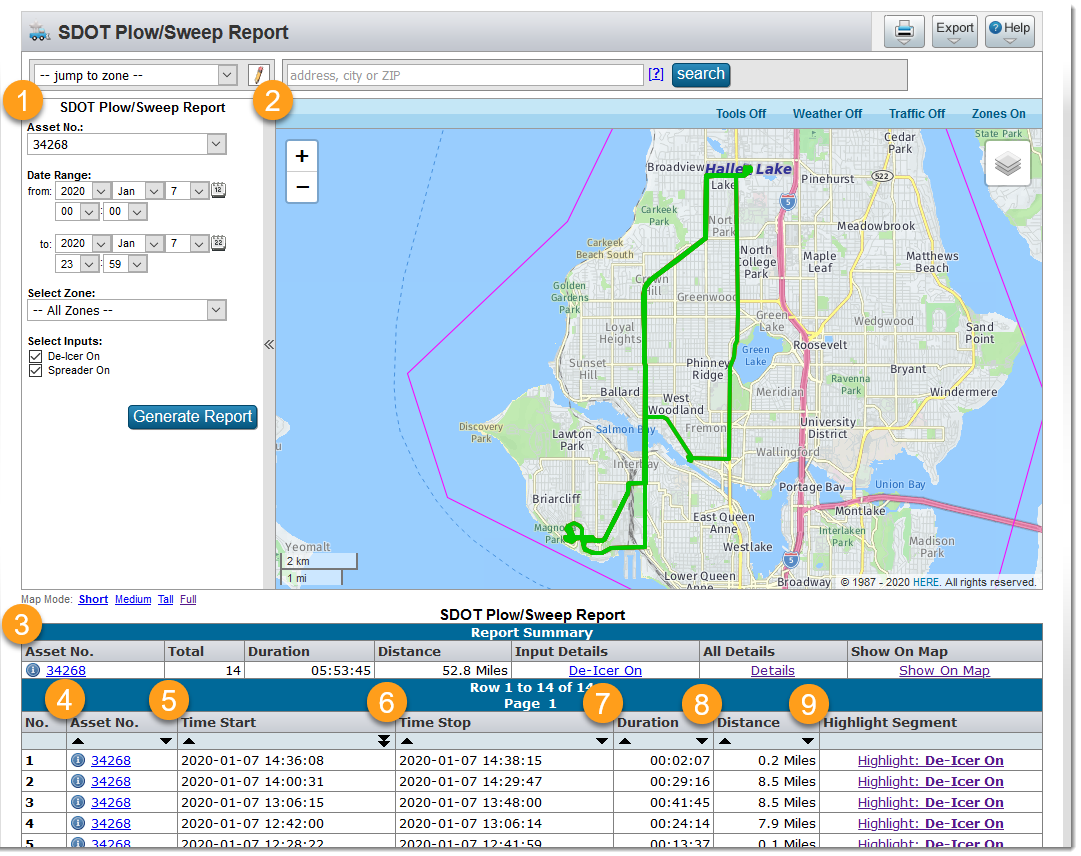
1. Filters
Select from the following options to generate a specified report:
| From/To | Select the specified beginning and ending dates for the report. |
| Select Zone | Select a zone to display the activity of an asset within a certain area of the map. Zones |
| Select Inputs | Check the box next to the following inputs that have been installed on an asset to display the activity of that input. |
2. Map
Displays plow or sweeping activity on the map. For map help, see Map Overview.
3. SDOT Plow/Sweep Report Summary
Displays a summary of the data generated within the report:
| Asset No. | Click the Asset Info Icon  to display the available asset information. Clicking the asset to display all EVIRs reported for that asset. to display the available asset information. Clicking the asset to display all EVIRs reported for that asset. |
| Total | Displays the total count of when the plow or sweep was activated and deactivated on the asset. |
| Duration | Displays the total time of when the asset’s plow or sweep was activated. |
| Distance | Displays the total distance that the asset traveled within the generated report. |
| Input Details | Displays the inputs that were activated during the report. Clicking on the link will display the input. |
| All Details | Displays every event occurred during the generated report for the selected asset. |
| Show On Map | Click the Show On Map link to display the activity of the asset while using selected inputs. |
4-9. Asset reports
| 4. Asset No. | Click the Asset Info icon  to display the available asset information. Click the asset to display all EVIRs reported for that asset. to display the available asset information. Click the asset to display all EVIRs reported for that asset. |
| 5. Time Start | Displays the beginning time of when the asset activated the I/O. |
| 6. Time Stop | Displays the ending time of when the asset deactivated the I/O. |
| 7. Duration | Displays the total duration of when the asset’s I/O was activated and deactivated. |
| 8. Distance | Displays the total distance the asset(s) traveled for the specified report. |
| 9. Highlight Segment | Click the link to populate the map with the associated event. |